Understand a Pathfinder track
The most important features to understand vessel behavior are within our Pathfinder reports. These reports give you a great overview of a vessel’s pattern of life.
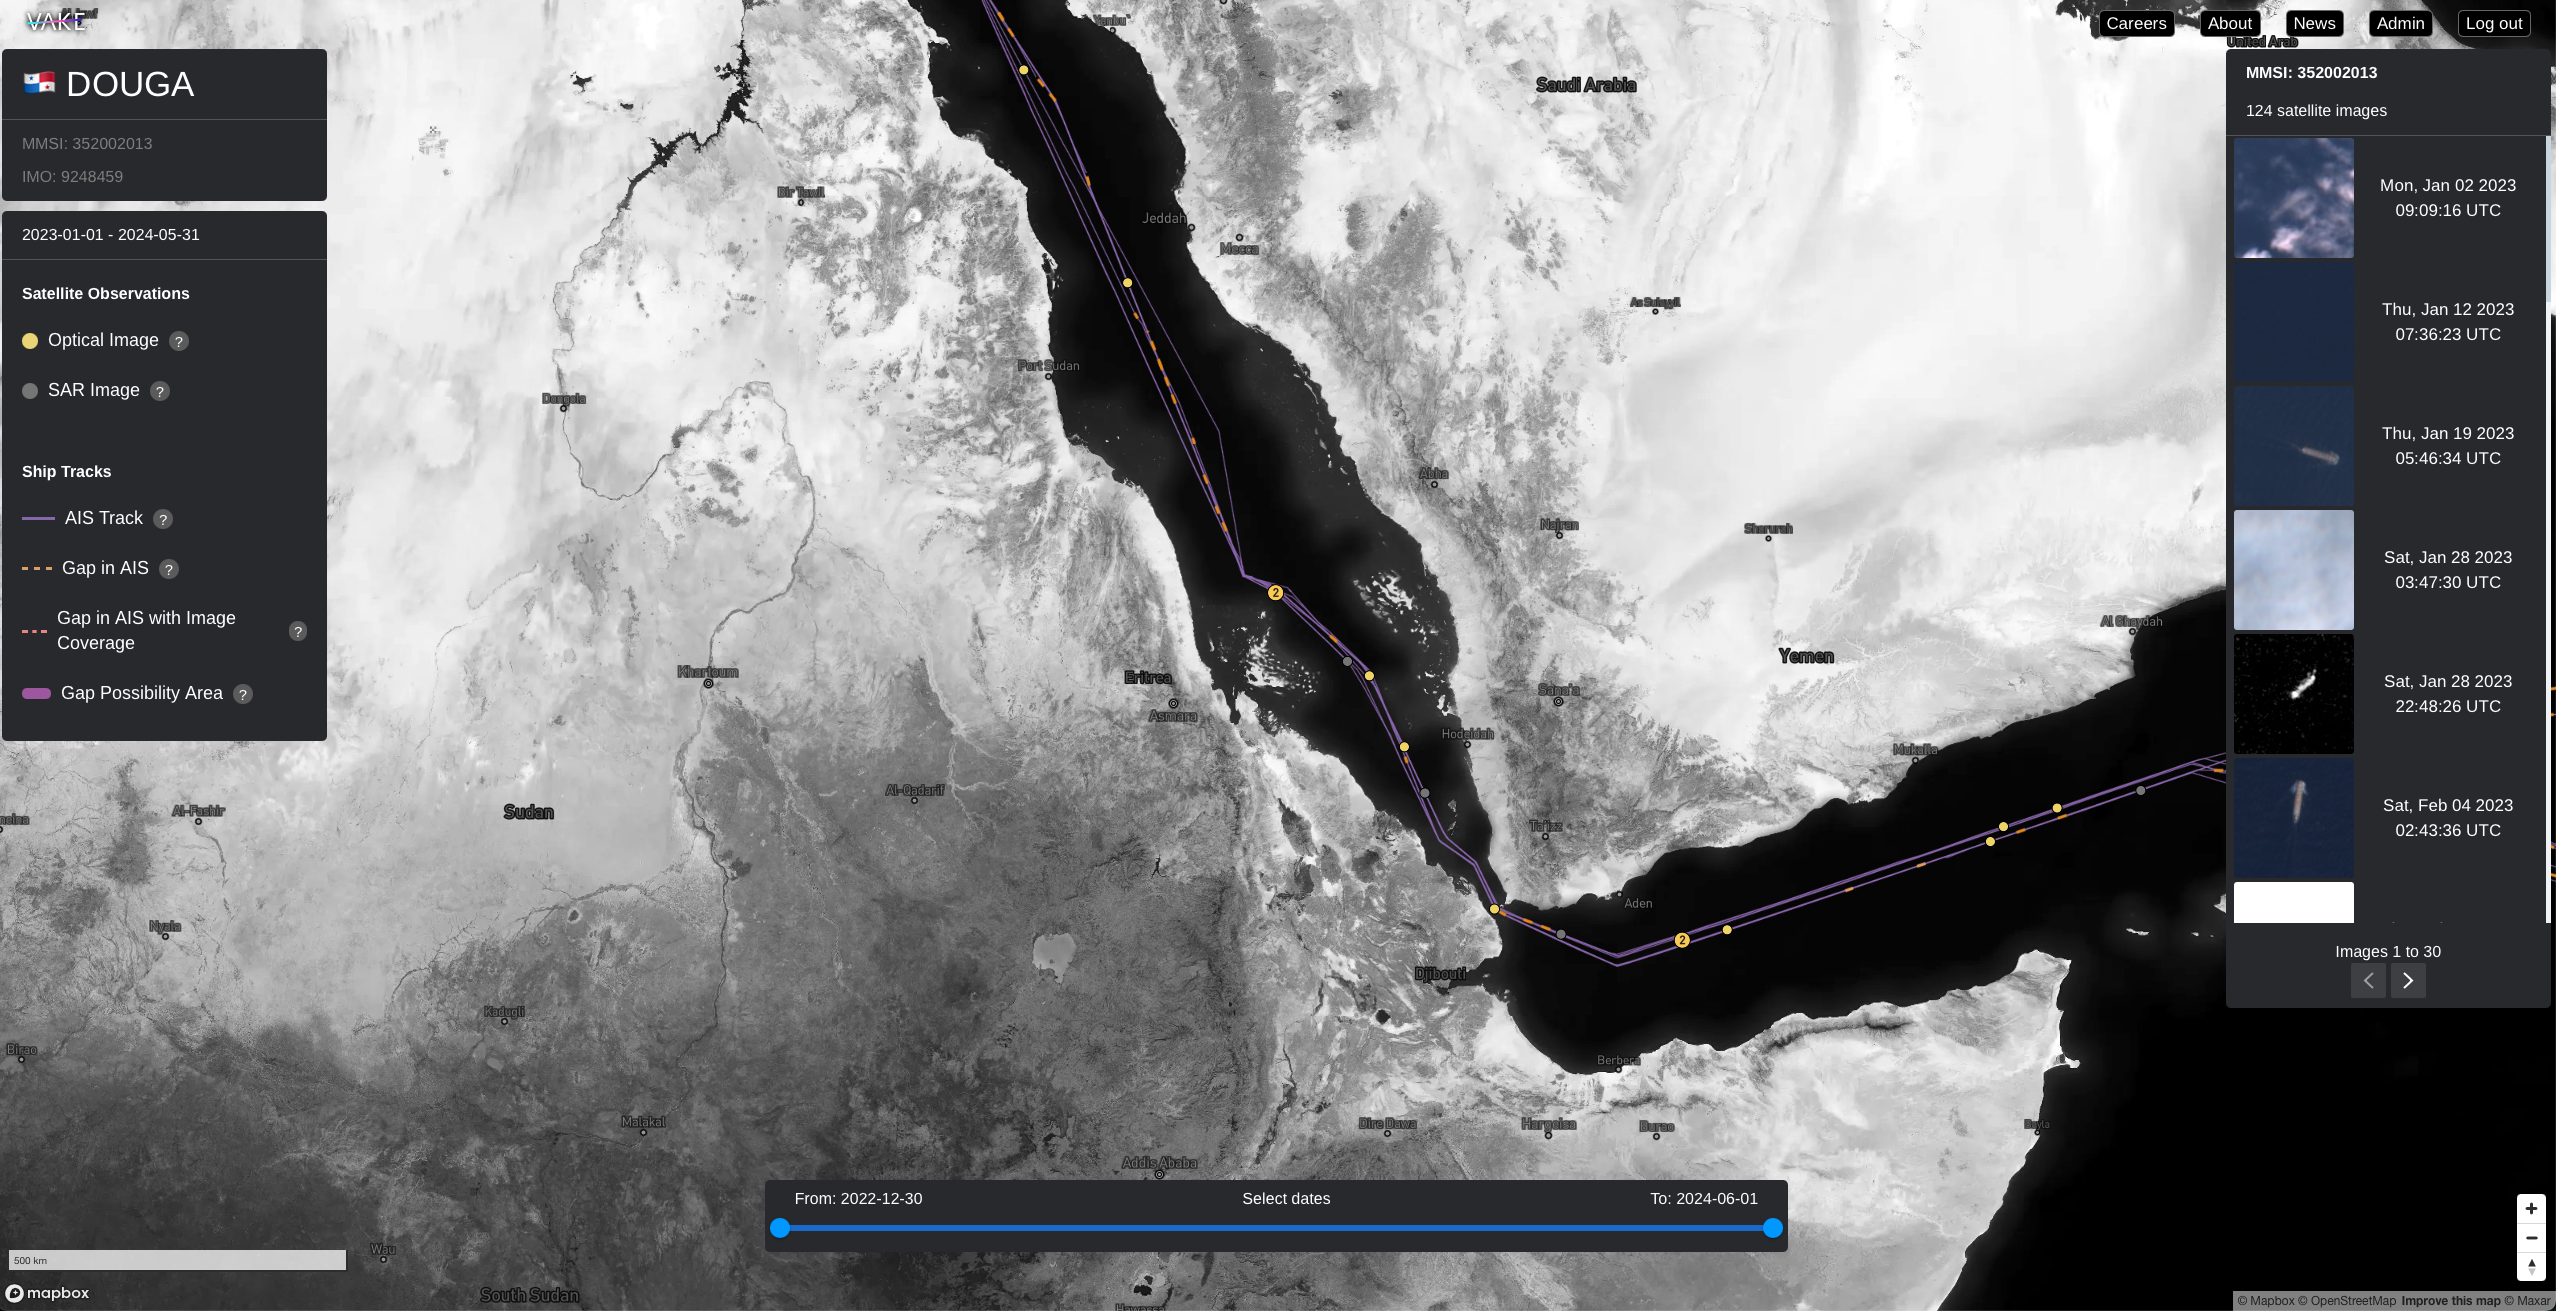
In the center of the report is the map, and the visual representation of the vessel track. On the left side you find the static menu, giving you descriptions and information about what you see in the map. On the right side is the dynamic menu. This menu will change based on what you click on, to give you relevant information such as satellite image details.
Static menu (left menu)
The static menu gives context to the report. In the top you find information about the vessel displayed in the report, such as name, MMSI, and IMO. Below are the legends explaining all different elements that you see in the map.
Satellite observations:
- Yellow dots are optical Sentinel-2 images, medium resolution optical captures overlapping with AIS track.
- Grey dots are Sentinel-1 synthetic Aperture Radar (SAR) captures overlapping AIS track.
Ship Tracks
- AIS track: the continuous AIS signal
- Gap in AIS: gap in AIS signals longer than 30 minutes. Can be caused of loss of AIS coverage, or vessels deliberately going dark.
- Gap in AIS with image coverage: AIS gap with satellite image pass, enabling detection of dark vessel.
- Gap possibility area: Maximum reach for the vessel, assuming max speed and the duration of AIS gap.
Dates:
The date-selector is currently positioned in a bottom center position. Think of this as a part of the static menu as well, giving context for your report. Use this selector to narrow down the track duration, or play with it to better understand the pattern for the vessel. The AIS track that is rendered on the map is a collection of lines (subtracks) separated by gaps in the AIS. In order to visualize the available data within the time period specified by the selector, the lines at either end of the interval are broken down into their respective AIS points instead of being rendered as lines. The current behaviour is, therefore, that a subtrack both “inside” and “outside” of the selected time period dissolves into points. When the entire subtrack is included by the selector, it reforms as a line. For very long subtracks (long periods of continuous AIS without gaps) this effect is quite dramatic.
Dynamic menu (right menu)
The dynamic menu is located at the right hand side, and displays all events for the vessel of interest. You can see satellite images as well as SAR images. Events are sorted by date.
Hovering the images in the dynamic menu makes the event in interest to be marked in the map. This makes it easy to connect the dynamic menu to the map.
By clicking either on an event in the menu, or by clicking on an event marked in the map, the dynamic menu changes to event-view, and gives you more information about this specific event, and relevant action(s) to this event.
Map
The map is the core visual navigation element in the report.
Navigating the map works in the same way as you are familiar with from other big maps-products
- Move around the map: Left**-**click and drag to navigate in the map..
- Zoom in or out of the map: Press the Plus (+) or Minus (-) keys in the bottom right corner. Tip: Hold command (Mac) / Ctrl (Windows) and use the scrollwheel on your mouse to zoom to the exact level you prefer.
- Tilt (3D mode): Right-click and drag to adjust tilt of the map.
Visual representation of the track:
- AIS track: the continuous AIS signal is displayed by a purple line
- Gap in AIS: gap in AIS signals longer than 30 minutes is visualise by dotted yellow lines. This can be caused of loss of AIS coverage, or vessels deliberately going dark.
- Gap in AIS with image coverage: AIS gap that are covered by a satellite image pass, enabling detection of dark vessel, are marked as a pink dotted line.
Visualised events:
- Yellow dots: indicate a satellite image of the vessel is taken on that spot.
- Grey dots: indicate a SAR-image of the vessel is taken at that spot.
- Dots with numbers / big yellow dots: indicates that there are several events connected to the spot. If a number is shown, the number indicates how many images/events are on that spot. Zoom in to see the individual events.